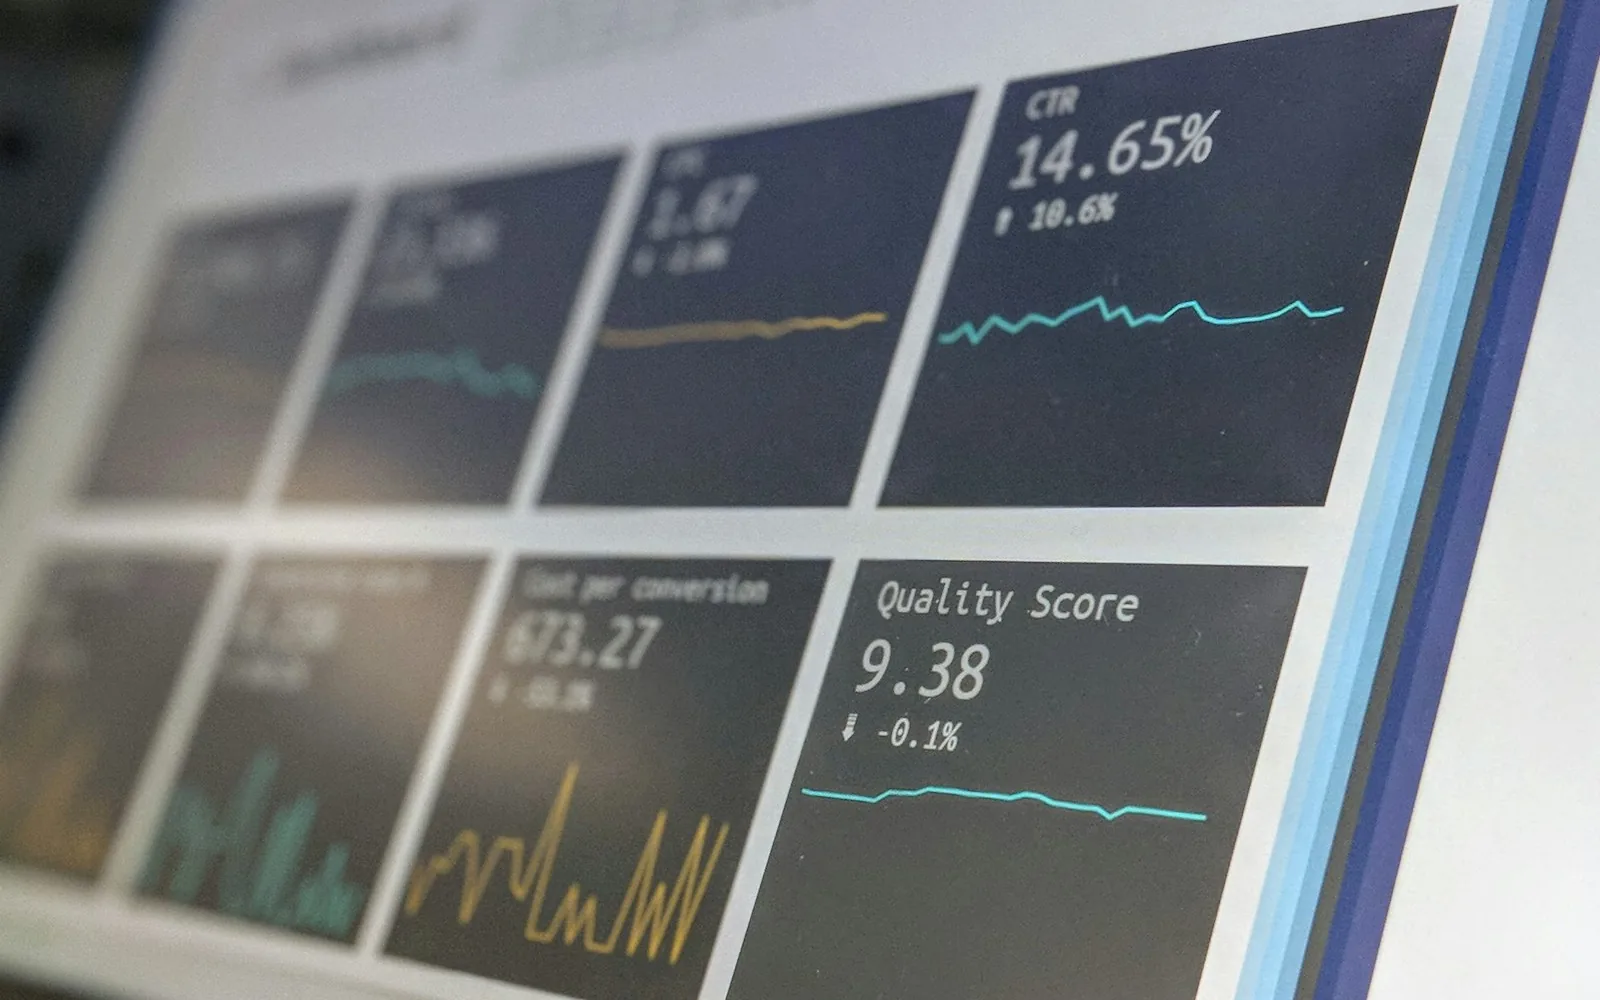
Most dashboards are built once and ignored. How to build one around the questions your team asks every week, so it becomes part of the routine.
A dashboard is supposed to answer questions at a glance. Too many end up as a wall of charts nobody looks at after the first week.
The difference between a useful dashboard and an ignored one is rarely the software. It is whether it was built around real questions.
Start with the questions, not the data
Before any charts, we ask the people who will use it: what do you check every Monday? What do you ask someone else for? What would you do differently if you knew it sooner?
Some typical answers:
- A café owner: which items sold out early this week, and which were thrown out?
- A clinic manager: how many appointments were no-shows, and which days are under-booked next week?
- A sports club coordinator: how many players are registered per team, and who hasn’t paid?
- An operations lead: where is each piece of shared equipment, and how long are people waiting for it?
Each of those is a dashboard tile. Anything that doesn’t answer a question someone asks stays off the screen.
Tracking tools come first
A dashboard is only as good as the records behind it. Often the real project is a simple tracking tool: a scan when equipment moves, a tap when an order is ready, a form when a job is finished. Once the record exists, the dashboard is the easy part.
Small habits that make it stick
- One screen. If it needs scrolling, it is two dashboards.
- Compare with something. “42 bookings” means little; “42, up from 35 last week” means a lot.
- Show when the numbers were last updated.
- Send a short weekly summary by email, so people don’t have to remember to look.
- Let people click through to the detail behind any number.
A good dashboard answers the question before anyone has to ask it in a meeting.
Trust the numbers
Nothing kills a dashboard faster than one wrong number. Spend time checking that the figures match what people already know to be true, and fix the data at the source rather than in the chart.
From the DYOL blog. Photo by Stephen Dawson on Unsplash.
Keep reading
All posts
Getting your tools to talk to each other
Most small businesses run on six to ten apps that don’t share anything. How integrations work, what they cost in effort, and where to start.
Online booking that fills the calendar instead of the inbox
Booking tools are easy to buy and easy to get wrong. The details that cut phone tag, no-shows and double bookings, for any business that runs on appointments.

Reading forms and documents with AI, without losing control
AI can now read scanned forms, IDs, receipts and letters well. Where that saves hours, and the checks that keep it safe.
A free 20-minute conversation, then an honest assessment. You’ll know what it costs and how long it takes, in writing, at a fixed price.
Or email lloyd.delacruz@outlook.com. We reply within 24 hours.